Tuesday, May 29, 2018

Manitex Adds A Strategic Partner

When writing about Manitex (MNTX), a small American manufacturer of boom truck cranes, knuckle-boom cranes, and other lifting equipment, I��ve often mentioned Tadano (6395.T) (OTC:TDNOF) as a peer/comparable, although Tadano and Manitex have relatively little direct overlap (some in rough terrain cranes and truck-mounted cranes). Now, these two companies will be even more closely tied together, as they announced a tie-up on Friday, May 25, that will see Tadano take a nearly 15% equity stake in the company.

Although the terms of the deal suggest to me that it��s slightly dilutive in the near term, Tadano��s investment should allow Manitex to retire a meaningful portion of its debt (perhaps around a third), reducing its operating risk and saving some interest expense, as well as help the company operationally. It could also, perhaps, be prelude to an eventual acquisition by Tadano. Although Manitex shares are no longer exceptionally cheap, there is still some upside here, particularly if Manitex can make faster progress growing its PM Group knuckle-boom crane business.

The Deal

The two companies announced that Tadano will acquire 2.92 million shares of Manitex at a trailing average price of $11.19, or about $32 million. The deal should close at month��s end, and when it does, Tadano will own just under 15% of Manitex shares. Tadano will also be allowed to appoint one member to Manitex��s board, and the initial pick is Tadano��s CEO for the American operations, Ingo Schiller.

Introducing Tadano

As a relatively small company, overall ($1.5 billion in enterprise value and $1.6 billion in trailing sales), Tadano is not really a household name to most American investors. Likewise, although Tadano technically has an ADR ticker, I believe it is essentially a placeholder ticker with no volume.

Although small, I believe Tadano can punch above its weight. Along with Kato Works, Tadano basically controls the Japanese market for rough terrain cranes with approximately 45% to 50% share (Kato holding around 40% to 45% share). Tadano also holds around 25% of the U.S. market for rough terrain cranes, 40%-plus of the Mideast market, 15% of the European market, and 40% of the ex-Japan Asian market. Tadano generates about 70% of its revenue from mobile cranes (rough terrain cranes, all-terrain cranes, and truck crane), another 10% to 15% from truck-loader cranes and truck-mounted aerial work platforms (each), and the remainder from parts, service, and used equipment. While Tadano has strong share in Japan with its truck-loader cranes and AWPs, those businesses aren��t so significant outside Japan today.

In Japan, rough terrain cranes are a favored choice for construction work, and virtually, all of Tadano��s Japanese sales are tied to construction in some form or fashion �� about a third from residential construction, a similar amount from non-residential construction, and 10% to 20% from infrastructure projects.

While rough terrain cranes hold more than 60% of the U.S. market for mobile cranes, Tadano hasn��t really penetrated markets like non-residential construction or infrastructure to a large extent. With that, about 70% of the company��s U.S. crane sales are tied to oil/gas applications. In Europe, Tadano��s efforts are limited by the fact that all-terrain cranes dominate the market, and while Tadano is building its all-terrain line-up, market leader Liebherr (with more than 50% share) benefits from a strong direct sales effort and the widest line-up of all-terrain cranes on the market.

Tadano��s primary competitors in the U.S. are Terex (TEX) and Manitowoc (MTW), both of which compete in rough terrain and all-terrain cranes. Tadano is not involved in tower cranes or crawler cranes, so Tadano��s overlap/impact on the overall sales of Terex and Manitowoc is somewhat limited. And, as I said before, Manitex and Tadano don��t compete head-to-head all that much �� there is some competition in rough terrain cranes, truck-mounted cranes, and specialized cranes, but really not that much.

Why Do This Deal?

This is a potentially interesting deal for both Manitex and Tadano, though a lot rides on just how much of that potential can actually be realized in the coming years. For Manitex, arguably the biggest near-term benefit is gaining access to Tadano��s distribution network, and particularly for Manitex��s knuckle-boom cranes (PM Group). This remains a very high-potential opportunity for Manitex, but one that has been limited by the need to grow the distribution network to get more cranes in front of potential customers.

Tadano��s perspective on it is a little different and perhaps more interesting for the long term. Tadano��s management talked about looking for synergies in product development, sales, and in joint purchasing. If these two companies working together can reduce their supply chain costs in the North American market, that��s potentially a big deal �� every quarter-point of gross margin in my Manitex model is worth about $0.04 of EPS. Tadano may also stand to benefit from Manitex��s greater exposure to the U.S. construction markets �� while Manitex too was once much more dependent upon oil/gas-related demand, the company has successfully pivoted toward a more construction-driven business mix (though recovering energy markets are certainly helping the business now).

The Opportunity

Although this deal appears slightly dilutive to Manitex in the near term (including lower interest expense and debt levels), improved procurement could potentially generate meaningful value from this deal, not to mention faster growth in the PM Group business. Although the shares look basically fairly valued on cash flow, I believe EBITDA-based valuation can support the shares into the mid-teens.

As for Tadano (for those investors who would consider investing in a Japanese stock), I think the shares offer double-digit long-term potential, but the near-term valuation is a little less compelling. Tadano recently reported another quarterly miss and reduced earnings expectations for the next fiscal year by more than 20% relative to prior sell-side expectations, though about half of that was tied to growth investments in the business. It��s also worth noting that the Japanese market, which generates around half of the company��s revenue, is likely going to see crane demand bottoming out from mid-2018 to mid-2019.

The Bottom Line

Time will tell if this investment is a prelude to an acquisition of Manitex by Tadano. Japanese companies don��t often acquire American companies, but I can see how Manitex would offer some appealing product line extension opportunities and market expansion opportunities in North America and Europe (to a lesser extent). Even if Tadano��s ownership never goes beyond 15%, though, this is a respectable way for Manitex to raise funds to pare down debt while perhaps accelerating the business plan for PM Group and potentially attaining meaningful cost savings down the line.

Disclosure: I am/we are long MNTX.

I wrote this article myself, and it expresses my own opinions. I am not receiving compensation for it (other than from Seeking Alpha). I have no business relationship with any company whose stock is mentioned in this article.

Editor's Note: This article discusses one or more securities that do not trade on a major U.S. exchange. Please be aware of the risks associated with these stocks.

SeekingAlpha

Saturday, May 26, 2018

BitcoinX (BCX) 24 Hour Volume Tops $630,952.00

BitcoinX (CURRENCY:BCX) traded down 2.8% against the US dollar during the 1 day period ending at 23:00 PM ET on May 26th. BitcoinX has a market cap of $0.00 and $630,952.00 worth of BitcoinX was traded on exchanges in the last 24 hours. One BitcoinX coin can currently be bought for approximately $0.0178 or 0.00000244 BTC on exchanges including Gate.io, ZB.COM, Huobi and CoinEgg. During the last seven days, BitcoinX has traded 10.7% lower against the US dollar.

Here is how similar cryptocurrencies have performed during the last 24 hours:

Get BitcoinX alerts: Mixin (XIN) traded up 2.6% against the dollar and now trades at $862.13 or 0.11803700 BTC. XinFin Network (XDCE) traded 8.4% lower against the dollar and now trades at $0.0046 or 0.00000063 BTC. ProCurrency (PROC) traded up 1% against the dollar and now trades at $0.0080 or 0.00000110 BTC. Sakura Bloom (SKB) traded down 20.3% against the dollar and now trades at $0.0039 or 0.00000053 BTC. LePen (LEPEN) traded 1.8% lower against the dollar and now trades at $0.0001 or 0.00000001 BTC. SHACoin (SHA) traded flat against the dollar and now trades at $0.0007 or 0.00000009 BTC.

BitcoinX Profile

BitcoinX (BCX) is a proof-of-stake (PoS) coin that uses the SHA256 hashing algorithm. Its genesis date was January 10th, 2014. BitcoinX’s total supply is 167,361,683,927 coins. The Reddit community for BitcoinX is /r/BCXofficial and the currency’s Github account can be viewed here. The official website for BitcoinX is bcx.org. BitcoinX’s official Twitter account is @bcx_team.

Buying and Selling BitcoinX

BitcoinX can be bought or sold on these cryptocurrency exchanges: Huobi, Gate.io, CoinEgg, BtcTrade.im, ZB.COM and OKEx. It is usually not currently possible to buy alternative cryptocurrencies such as BitcoinX directly using US dollars. Investors seeking to trade BitcoinX should first buy Ethereum or Bitcoin using an exchange that deals in US dollars such as Gemini, Coinbase or GDAX. Investors can then use their newly-acquired Ethereum or Bitcoin to buy BitcoinX using one of the aforementioned exchanges.

new TradingView.widget({ “height”: 400, “width”: 650, “symbol”: “BCXUSD”, “interval”: “D”, “timezone”: “Etc/UTC”, “theme”: “White”, “style”: “1”, “locale”: “en”, “toolbar_bg”: “#f1f3f6”, “enable_publishing”: false, “hideideas”: true, “referral_id”: “2588”});

Friday, May 25, 2018

Franco-Nevada Is My First Choice

Courtesy: Madison

Investment Thesis:

Franco-Nevada (FNV) is considered the poster child for the "streamers" such as Wheaton Precious Metals (WPM), Osisko Gold Royalties (OR), Royal Gold (RGLD), or the junior Sandstorm Gold (SAND).

The company fundamentals are solid with a potential for long-term growth, the company has no debt and pays a 1.36% dividend annually supported by free cash flow. The business model is solid with limited risk, and the company is diversifying now into the oil segment with about 7.2% of its first-quarter revenues coming from oil. Sandip Rana, the CFO, said in the conference call:

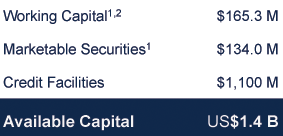
We currently have $1.4 billion of available capital, when including our credit facilities. During the quarter, we funded $90 million for the Delaware oil transaction, as well as the Cobre Panama stream addition for $356 million. The company continues to have no debt.

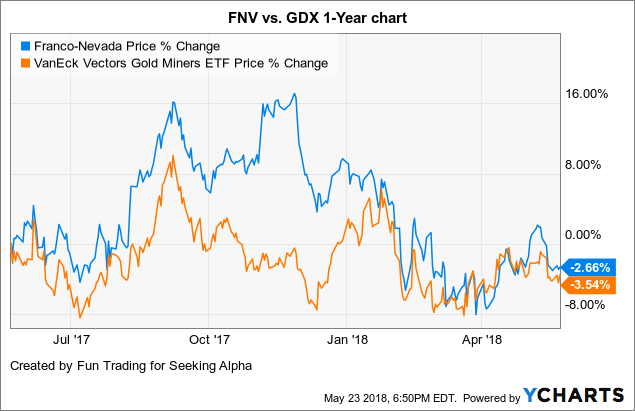
This business success has been translated by a substantial gain in the stock price with the stock almost continuously outperforming the VanEck Vectors Gold Miners ETF (GDX) since January.

Chart

FNV data by YCharts

Therefore, FNV is a stock that should be considered as a long-term investment with only sparse trading using the ups and downs of the market.

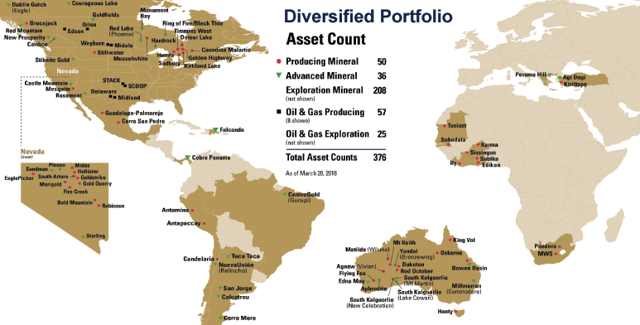
Highly Diversified Portfolio

Source: FNV Presentation May 2018

Franco-Nevada: Balance Sheet and Production in 1Q'2018
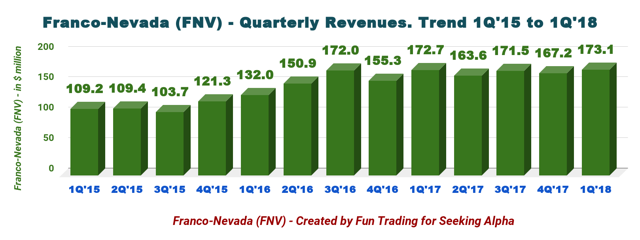
Franco-Nevada 2Q'15 3Q'15 4Q'15 1Q'16 2Q'16 3Q'16 4Q'16 1Q'17 2Q'17 3Q'17 4Q'17 1Q'18
Total Revenues in $ Million 109.4 103.7 121.3 132.0 150.9 172.0 155.3 172.7 163.6 171.5 167.2 173.1
Net Income in $ Million 21.6 15.2 ��31.4 30.0 42.3 54.4 ��4.5 45.6 45.6 60.0 43.5 64.6
EBITDA $ Million 82.2 74.0 30.9 104.9 122.6 140.9 76.9 128.3 124.7 134.2 125.0 77.4
Profit margin % (0 if loss) 19.7% 14.7% 0 22.7% 28.0% 31.6% 0 26.4% 27.9% 35.0% 26.0% 37.3%
EPS diluted in $/share 0.14 0.10 ��0.20 0.18 0.24 0.30 ��0.03 0.25 0.25 0.32 0.23 0.35
Cash from operations in $ Million 78.0 72.4 88.9 124.0 103.5 121.6 121.9 119.8 126.5 116.0 126.3 137.5
CapEx in $ Million 2.8 1.7 68.2 0.7 1.3 1.8 2.3 2.0 1.9 1.8 499.9 0
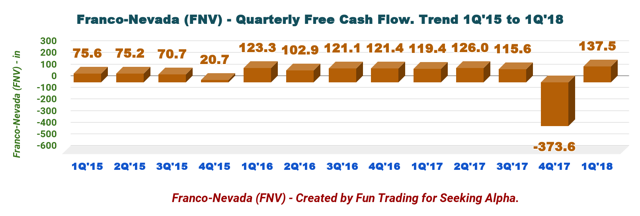
Free Cash Flow in $ Million 75.2 70.7 20.7 123.3 102.9 121.1 121.4 119.4 126.0 115.6 -373.6 137.5
Total Cash $ Million 610.8 605.4 168.0 176.3 225.8 277.6 253.0 283.0 614.3 546.0 87.7
Long term Debt in $ Million 0 0 0 0 0 0 0 0 0 0 0 0
Dividend per share in $ 0.21 0.21 0.21 0.21 0.22 0.22 0.22 0.22 0.23 0.23 0.23 0.24
Shares outstanding (diluted) in Million 156.8 167.8 156.9 166.8 177.8 180.2 176.1 182.4 181.6 178.1 189.1 185.9
GEO's 2Q'15 3Q'15 4Q'15 1Q'16 2Q'16 3Q'16 4Q'16 1Q'17 2Q'17 3Q'17 4Q'17 1Q'18
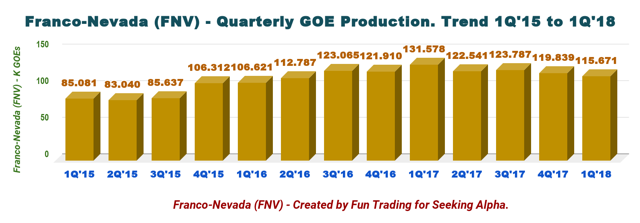
Production gold equivalent Oz Eq. 83,040 85,637 106,312 106,621 112,787 123,065 121,910 131,578 122,541 123,787 119,839 115,671
Gold price 1,193 1,124 1,104 1,181 1,259 1,335 1,218 1,219 1,257 1,278 1,257 1,329

Source: Company filings and Morningstar

Trends And Charts: Revenues, Earnings Details, Free Cash Flow, Debt, And Production Details

1 - Revenues

Sandip Rana, the CFO, said in the conference call:

The company achieved a number of financial records, which are all highlighted. The company did benefit from higher commodity prices during the quarter, particularly gold and oil, as well as benefiting from revenue generated by new oil and gas acquisitions we made over the last two years. And due to the lower-cost nature of our business model, recent commodity prices did have a significant impact on the company's EBITDA, margin and net income.

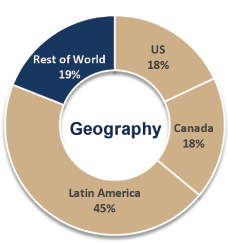
In the first quarter, revenues were a record $173.1 million. For 1Q'18, revenue was sourced 87.3% from precious metals (68.3% gold, 13.6% silver, and 5.4% PGM) and 80.6% from the Americas (44.5% Latin America, 17.7% U.S., and 18.4% Canada).

Source: FNV Presentation

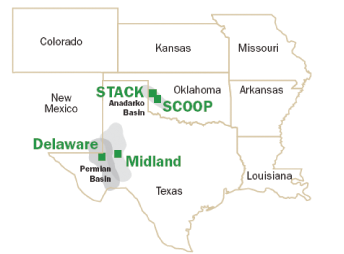
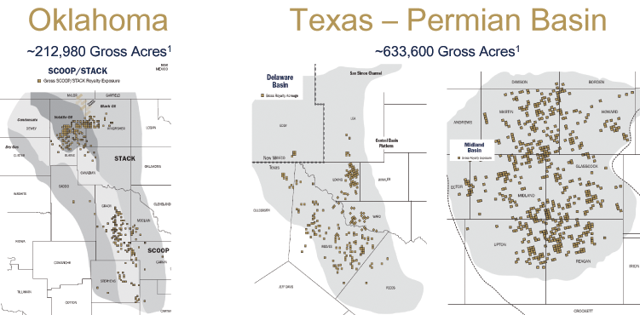
Note about the Delaware Oil & Gas Royalties: Franco-Nevada finalized the purchase of a royalty portfolio in Delaware, which represents the western portion of the larger Permian Basin in Texas for $101.3 million on February 20, 2018. The royalties are derived principally from a mineral title which provides a continued interest in royalty lands. The transaction has an effective date of October 1, 2017. Revenue in 1Q'18 included $1.3 million from the Delaware royalties.

2 - Free Cash Flow

Free cash flow for FNV was $137.8 million compared to $119.4 million the same quarter in 2017.

Note about Cobre Panama: Franco-Nevada funded the additional precious metals stream on the Cobre Panama project for $356.0 million on March 16, 2018. Franco-Nevada now has exposure to the precious metals produced from 100% of the ownership of the Cobre Panama project.

Furthermore, the company shows a robust capital availability.

Source: Presentation

3 - Production in Gold equivalent ounce and details

Gold equivalent production was lower compared to a year ago. The number of gold equivalent ounces from gold assets, excluding NPIs decreased year-over-year - which was in line with expectations - as the company expected a reduction in gold and silver ounces delivered from Candelaria, Guadalupe, and South Arturo in 2018.

Source: FNV Presentation

The reduction deliveries in Candelaria and South Arturo are temporary, and Franco-Nevada is expecting higher production in 2019 onwards. Total production was 115,671 Geos with 76.8% coming from gold.

For Q1 2018, operating margin is 80.8% per GEO or $1068/Oz. It is slightly higher year over year, due mostly to the fact that most of the production came from the stream as explained above.

A reminder on the oil & gas segment, Franco-Nevada acquired oil & gas assets for a total of $110 million.

Franco-Nevada agreed to acquire a package of royalties in the Midland Basin for a price of $110 million. The Midland Basin comprises the eastern portion of the broader Permian Basin, which is located in west Texas, and which is known to be one of the most active plays in North America.

During the 1Q'18, oil & gas revenue increased 74.3% year-over-year, reflecting the addition of the STACK, Midland, Orion, and Delaware royalties, higher prices and increased payments from Weyburn.

Source: FNV Presentation

Franco-Nevada has invested ~$340 million to date in its oil segment.

Guidance 2022

The company expects an increase of production Geos of 17% from 2017 to 2022 and an increase in oil & gas revenues of 81% for the same period.

Commentary

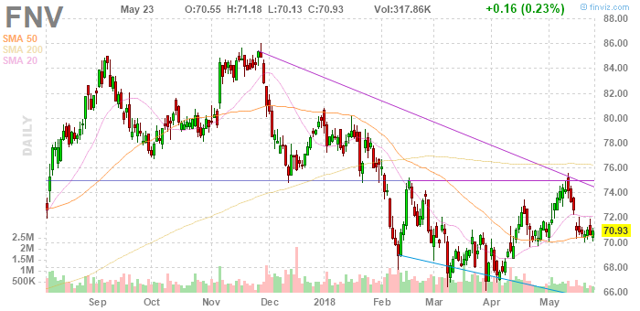
Despite an evident business success, the stock strongly corrected after reaching a high of $86 in late November 2017 as I have been warning my followers about it, due to an overvalued and overbought situation.

From almost $86, FNV dropped to $67 in four months or a 22% haircut. However, since April, the stock recovered a little and seems trading at intermediate support now around $70 (buy flag).

Last year, I had indicated that "we own a large position in FNV and we decided to take some profit off the table at $84.75 early September when the RSI was flashing an overbought situation."

The good news is that we bought back most of it at or below $68 in March-April, and we may add more under $70 now (Buy flag).

The thesis is pretty simple. Franco-Nevada is the best streamer in this category, and its future growth and financial stability is the perfect example of what a long-term investor is expecting. However, as always, when it comes to gold stock, it is imperative to adopt a trading/investing strategy in correlation with the price of gold and silver.

I recommend now FNV as a Buy at $70.

Author's note: Do not forget to follow me on the gold sector. Thank you for your support; I appreciate it. If you find value in this article and would like to encourage such continued efforts, please click the "Like" button below as a vote of support. Thanks!

Disclosure: I am/we are long FNV.

I wrote this article myself, and it expresses my own opinions. I am not receiving compensation for it (other than from Seeking Alpha). I have no business relationship with any company whose stock is mentioned in this article.

Thursday, May 24, 2018

Why Nvidia (NVDA) Stock Is a Strong Buy

Shares of Nvidia (NVDA ) have slipped since the company reported strong first quarter financial results on May 10. This slight post-earnings dip might present investors the best chance to buy Nvidia stock at this price for some time. Let’s take a look why.

Q1

To briefly recap Nvidia’s first quarter, the company’s adjusted earnings skyrocketed 141% from the year-ago period to $2.05 per share. Meanwhile, the Santa Clara, California-based tech power’s revenues soared 66% to $3.21 billion. Furthermore, Nvidia’s crucial Gaming revenues popped 68% to touch $1.72 billion.

Future

Looking quickly ahead, Nvidia is projected to report second-quarter revenues of $3.11 billion, based on our current Zacks Consensus Estimates. This would mark over a 39% climb from the prior-year quarter. For the full-year, Nvidia’s revenues are expected to surge nearly 36% to touch $13.18 billion.

Moving on to the opposite end of the income statement, Nvidia’s bottom line is projected to expand by more than 81% in the second quarter to reach $1.83 per share. This outsized growth is expected to continue for the full-year, with Nvidia’s earnings projected to soar just over 60% to reach $7.90 per share.

Price Movement

On top of Nvidia’s strong first quarter and its impressive growth outlook, investors will want to take a quick glance to see how its stock has performed recently.

Shares of Nvidia have soared nearly 79% during the last year, which crushes the S&P 500’s 13.5% climb. Nvidia’s performance also outpaces its industry’s roughly 56% growth. For reference, Nvidia’s industry includes the likes of Texas Instruments (TXN ) and Intel (INTC ) . NVDA looks even better against the broader semiconductor market’s roughly 36% climb.

Jumping back over the last three years, Nvidia’s shares have skyrocketed 1,085% as its GPUs become more and more important in the multibillion-dollar gaming industry, data centers, and more. But even in the near-term, Nvidia’s stock price performance looks strong. Shares of NVDA have climbed nearly 28% since the start of the year, against its industry 18% climb and the S&P 500’s 2% expansion.

Despite Nvidia’s insane run of success and strong first quarter, shares of Nvidia closed Wednesday at $247.54 per share, which sits roughly 5% below its 52-week high of $260.50 per share.

Valuation

Now that we have looked at Nvidia’s recent quarterly performance and stock price movement, let’s get a feel for its current valuation picture. Coming into Thursday, Nvidia stock was trading at 34.7X forward 12-month Zacks Consensus EPS estimates, which marks a significant premium compared to its industry’s 18.3X and the S&P 500’s 16.9X.

But, Nvidia investors understand that the stock is a growth play at the moment and are likely not concerned about the company’s current valuation picture, especially considering its massive climb over the last several years. With that said, NVDA has traded as high as 57.4X forward 12-month earnings estimates over the last year, with a one-year median of 45.6X.

As investors can see, Nvidia stock is currently trading just above its year-long low and well below its high and median. Therefore, investors should be able to say with some confidence that Nvidia stock is not expensive at the moment. To some, Nvidia’s valuation might even appear rather attractive at its current level.

Bottom Line

Nvidia is currently a Zacks Rank #1 (Strong Buy) and sports an “A” grade for growth in our Style Scores system. Investors should also be pleased to note that Nvidia has received 11 earnings estimate revisions for its second quarter, with 100% agreement to the upside, all within the last 30 days. During this same timeframe, NVDA earned 12 full-year revisions, with the same 100% upside agreement.  

Lastly, aside from data centers and gaming, Nvidia is ready to benefit from its presence in booming growth industries from artificial intelligence to self-driving vehicles. 

Wall Street’s Next Amazon

Zacks EVP Kevin Matras believes this familiar stock has only just begun its climb to become one of the greatest investments of all time. It’s a once-in-a-generation opportunity to invest in pure genius.

Click for details >>

Wednesday, May 23, 2018

3 Growth Stocks That Could Put Facebook's Returns to Shame

Facebook (NASDAQ:FB)�may have been one of the most hyped IPOs in history. But brave investors who bought on the first day of trading and held until today have enjoyed total returns of 377%. That's an incredibly impressive return, especially when considering that Facebook has been a public company for only about six years.

So, which stocks do we think can put up Facebook-like returns in the years ahead? We asked a team of top Motley Fool investors to weigh in, and they picked Shopify (NYSE:SHOP),�Square (NYSE:SQ), and MercadoLibre (NASDAQ:MELI).�

Money raining down on business man with umbrella

Image source: Getty Images.

Bringing customers right in the door

Dan Caplinger (Shopify): Facebook has been an amazingly successful company, having found a way to build an impressive network of users and then make money linking its members to the goods and services they're most likely to want through advertising. Some users find that level of catering to individual tastes off-putting, but the amount of money available through e-commerce makes the demand for sales leads worth the potential reputational risk.

Shopify is looking to cash in on the same e-commerce growth, but it's looking to do so more actively by helping its clients build their own e-commerce presence. By doing so, Shopify is tapping into a growing entrepreneurial spirit in the global marketplace, as people with innovative products and services realize that the traditional route of finding a large-scale professional distributor or retailer is too competitive and fraught with potential pitfalls to be worth the risk in many cases. Shopify's tools let businesses establish themselves on the internet cheaply and efficiently, but they also have scalable capabilities that can grow along with a client's e-commerce business needs.

Shopify's most recent results show that the company continues to grow fast. Some lingering concerns remain among high-growth investors that the e-commerce services provider won't grow fast enough to justify its past share-price gains, but Shopify's core business remains strong. By giving clients a direct link to customers, Shopify could give e-commerce entrepreneurs the ability to bypass channels like Facebook -- while producing profits for itself in the long run.

Facebook-like potential to build a payments ecosystem

Matt Frankel (Square): Square's stock price has more than quintupled over the past two years, but for good reason. And there could be lots of upside ahead.

First, Square's core payment processing business is a huge global opportunity, especially since Square focuses on smaller merchants for whom card acceptance has historically been prohibitively expensive. It's estimated that two-thirds of businesses around the world still don't accept card payments, and it's fair to assume that a disproportionately high percentage of these are at the smaller end of the spectrum -- Square's bread and butter. Worldwide card payment volume is expected to reach $55 trillion per year by 2025, so to say this is a huge opportunity is an understatement.

As if this weren't enough, Square is leveraging its customer base to create a small-business ecosystem. Its fast-growing Square Capital business lending platform earns interest income by meeting customers' financing needs, the Caviar food delivery platform targets Square's restaurant customers, and most recently, the acquisition of Weebly will allow Square's customers to develop their e-commerce presence without venturing outside of the company's ecosystem.

Finally, on the personal side, Square is emerging as a leader in the peer-to-peer payments business, as the Square Cash app is the No. 1 financial app in the App Store. Also, its recent bitcoin integration could grow into a big revenue driver if cryptocurrencies continue to grow in popularity.

In a nutshell, Square has several avenues of growth that fuel each other's success, and there is still lots of untapped potential to expand.

A misunderstood report

Brian Feroldi (MercadoLibre): MercadoLibre, which is�known to many investors as the "Amazon &�Ebay�& Paypal & Craigslist of Latin America," recently reported abysmal results. Sales "only" grew by 19%, which is far slower growth than investors are used to seeing�from the company. To make matters worse, this profitable company reported a net loss for the period. Those are tough numbers for growth investors to swallow. When combined with the crisis in Venezuela, it's no surprised to see that shares have fallen by more than 28% in the last two months alone.

So, is the bull case for owning this stock over?�

I'm a firm believer that the answer to that question is "no." My reasoning is that the company's rotten first-quarter results are more of a reflection of recent changes to U.S.�accounting standards than a sign that the business is under distress. What's more, this quarter also coincided with a large uptick in shipping costs in Brazil. If you strip away those factors, then revenue would have grown by 60%, and the company would have been profitable.�

A quick look at the company's key operating metrics also shows that the platform remains as popular as ever. Registered users jumped by 22%, items sold increased by 50%, and payment transactions jumped 68%. These numbers are much more indicative of the overall health of the business because they are not impacted by accounting changes or currency movements.

Overall, I think investors have every reason to believe that MercadoLibre is as strong as ever and is built for long-term growth. With shares trading significantly below their 52-week high, I think right now is a fine time for growth investors to get in.

Sunday, May 20, 2018

Chico's FAS Embraces the Future With an Amazon Partnership

Like many brick-and-mortar retailers, it's been a tough path for Chico's FAS (NYSE:CHS). Over the last five years, shares of the clothier are down about 40%. The difference has been a shift from consumers away from store-based retail to e-commerce -- most notably in the form of�Amazon.com (NASDAQ:AMZN).

In a nascent but growing trend, retailers are deciding that if you can't beat 'em, join 'em. As a result, they're collaborating with companies like Amazon to immediately improve their e-commerce operations. Count Chico's FAS as the next big brand to seek out such a partnership.

Packages in a small cart on top of a laptop keyboard.

Image source: Getty Images.

Chico's new deal can reverse sluggish sales

Chico's recently announced a partnership with Amazon, bringing its merchandise to the massive online marketplace. Plans are to make the apparel eligible for Amazon Prime, which includes free two-day shipping. While the initial partnership will only include jewelry, athleisure, and limited Chico's brands, the company plans to eventually bring its Soma line of lingerie and its White House Black Market upscale collection to the mix.

Leveraging Amazon's logistical prowess and traffic to build sales is a smart move for Chico's. Last fiscal year, the company reported $2.3 billion in revenue, the lowest figure since fiscal year 2011. Comparable sales also decreased 7.7% due to lower foot traffic and lower average ticket values.

Amazon's partnership has worked for Adidas

Amazon has been working to add name-brand apparel retailers to its site. The company has started a tentative relationship with Nike to bring its line of shoes and apparel to Amazon.com. In doing so, Nike joins Adidas�(NASDAQOTH:ADDYY) as an Amazon partner -- and not a moment too soon as the latter had gained significant footwear market share in recent years, pushing past Nike's Jordan brand to become the No. 2 brand in sports footwear.

Adidas' growth has been accomplished via unconventional methods. It has focused less on performance footwear and more on lifestyle brands -- embracing non-athletic partnerships with rapper Kanye West and American model and TV personality Kendall Jenner. The company has also�sought out new sales channels�like Amazon. Recently, Adidas called Amazon "a very good customer of ours" when referencing the three-year relationship.

Amazon is the clear winner here

While Chico's may benefit from the relationship in the short run, Amazon investors should be encouraged by the continued migration of brands from competing with Amazon in e-commerce to partnering with it.

Perhaps the biggest misconception about Amazon is it has no room for growth due to its large market cap. The reality is that e-commerce is still in its early stages, only accounting for just over 9% of total retail spending in the fourth quarter of 2017. However, e-commerce continues to grow rapidly, posting a 17% year-over-year increase that same quarter.

Now, it's possible the company could dominate even more of the growing e-commerce industry as more brands decide to offer their products through its site.